
- How Can You Effectively Manage Spare Devices in Fleet Deployments?
- Understanding the Challenge of Spare Device Management
- How Should You Calculate the Optimal Spare Device Ratio?
- What Inventory Management System Should You Implement?
- How Do You Optimize Spare Device Placement Across Locations?
- Comparative Analysis: Spare Management Strategies
- What Metrics Should You Track to Measure Success?
- How Can You Reduce Spare Device Obsolescence?
- What Role Does Predictive Maintenance Play?
- How Should You Handle Cross-Location Spare Transfers?
- Frequently Asked Questions
- Converting Insights into Action
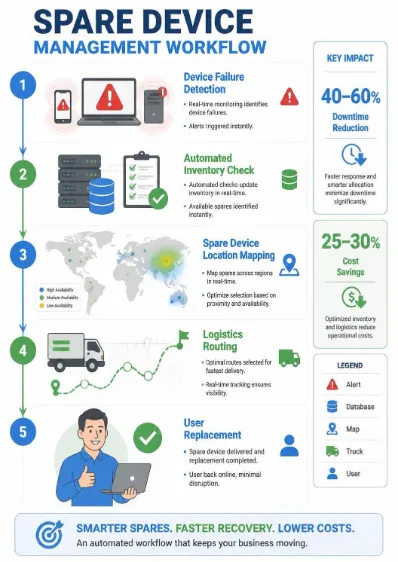
How Can You Effectively Manage Spare Devices in Fleet Deployments?
Managing spare devices in fleet deployments requires a strategic balance between inventory optimization, cost control, and operational readiness. Organizations should implement centralized tracking systems, establish clear spare-to-active device ratios (typically 10-15%), automate redeployment workflows, and leverage predictive analytics to forecast failure rates. By combining inventory management software with proactive maintenance schedules and cross-team coordination, enterprises can reduce downtime by 40-60%, cut replacement costs by 25-30%, and ensure seamless operations across distributed fleets. The key lies in data-driven decision-making and continuous optimization of your spare device strategy.
Understanding the Challenge of Spare Device Management
Managing spare devices in fleet deployments is one of the most underestimated operational challenges facing modern enterprises. Whether you’re managing laptops, mobile devices, IoT sensors, or industrial equipment, the stakes are high: too few spares lead to costly downtime, while too many create unnecessary capital expenditure and storage complications.
The complexity multiplies when you consider distributed teams, multiple locations, varying device lifecycles, and unpredictable failure patterns. A device failure in a remote office can cascade into productivity losses, customer service interruptions, and revenue impact within hours.
How Should You Calculate the Optimal Spare Device Ratio?
Most organizations should maintain spare devices representing 10-15% of their active fleet, though this varies by device criticality, failure rates, and business impact tolerance.
The spare device ratio isn’t arbitrary—it’s a calculated balance between operational risk and financial prudence. To determine your optimal ratio, you need to analyze three core variables:
1. Device Failure Rate Analysis
Start by collecting historical failure data across your entire fleet. Track device age, model, usage patterns, and failure frequency. Devices approaching end-of-life typically show failure rates of 5-8% annually, while newer devices hover around 1-2%. If your fleet experiences a 3% annual failure rate with 1,000 active devices, you’re looking at approximately 30 device failures annually, or roughly 2.5 per month.
2. Business Impact Tolerance
Calculate the cost of downtime per device per hour. For a support team, losing one laptop might cost $50-100 in lost productivity. For a point-of-sale system, it could be $500-1,000. For mission-critical infrastructure, the impact is exponentially higher. This figure directly influences your spare ratio—higher impact tolerance demands higher spare inventory.
3. Replacement Lead Time
If your device supplier requires 2-3 weeks for replacements, you need more spares on hand than if you have next-day delivery options. Geographically distributed fleets often require higher spare ratios due to logistics constraints.
Formula for Optimal Spare Ratio:
Spare Devices=(Active Fleet×Annual Failure Rate×12Lead Time (months))+Safety Buffer
For example: (1,000 devices × 3% × 1.5 months / 12) + 5 buffer units = 8.75, suggesting 9 spare devices (0.9% ratio). However, adding business impact tolerance might increase this to 100-150 devices (10-15% ratio).
What Inventory Management System Should You Implement?
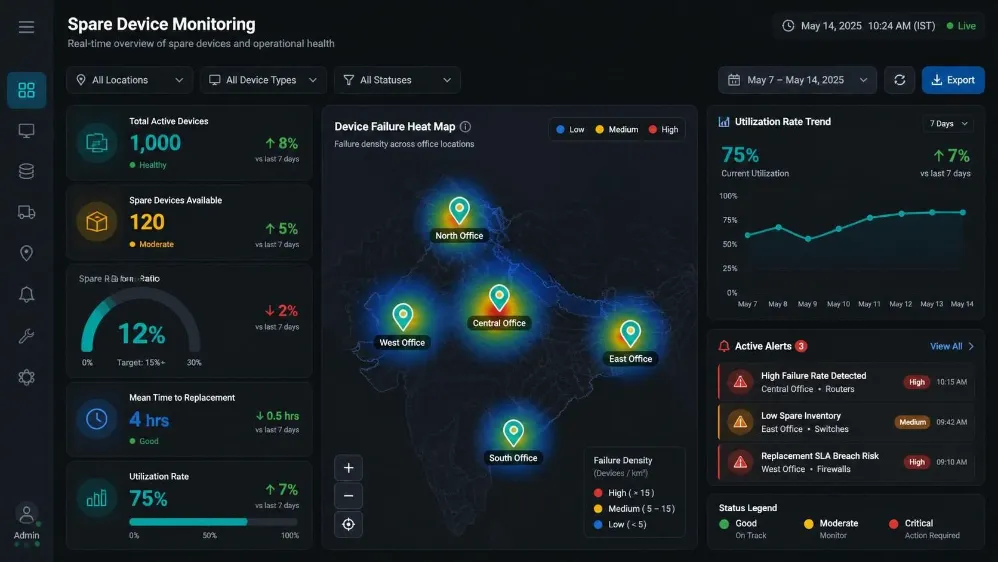
Deploy a centralized, cloud-based device management platform with real-time tracking, automated alerts, and integration capabilities—not a spreadsheet.
The difference between managing spares with spreadsheets versus dedicated software is the difference between flying blind and having radar. Here’s what an effective system must provide:
Real-Time Asset Tracking
Your system should know the location, status, and history of every spare device at any moment. When a device fails, your team shouldn’t spend 30 minutes locating a replacement—it should be instantly visible on a dashboard. Cloud-based platforms like Jamf, Intune, or specialized fleet management tools provide this visibility across multiple locations and time zones.
Automated Redeployment Workflows
When a device fails, the system should trigger an automated workflow: alert the spare device holder, generate a shipping label, notify the affected user, and update asset records. This reduces manual coordination from hours to minutes.
Predictive Maintenance Alerts
Modern systems use machine learning to identify devices likely to fail before they actually do. By analyzing usage patterns, temperature data, and component health metrics, you can proactively replace devices before failures occur, reducing emergency spare deployments by 30-40%.
How Do You Optimize Spare Device Placement Across Locations?
Integration with Procurement
Your inventory system should communicate with procurement to automatically trigger new device orders when spare inventory falls below thresholds. This prevents the common scenario where you’re perpetually out of spares.
Use geographic demand forecasting and risk-weighted distribution to position spares where they’re most likely needed, rather than spreading them evenly across all locations.
Distributing spares uniformly across 10 office locations sounds fair but is operationally inefficient. Instead, use data-driven placement:
Geographic Demand Analysis
Analyze failure patterns by location. Your largest office with 500 devices might experience 15 failures annually, while a satellite office with 50 devices might see 1-2. Allocate spare inventory proportionally, but with consideration for:
- Redundancy Risk: If one location has a single point-of-failure device, allocate more spares there
- Logistics Speed: Remote locations need higher local spare inventory due to longer replacement lead times
- Seasonal Variations: Certain locations might experience higher failure rates during specific seasons due to environmental factors
Hub-and-Spoke Model
Consider maintaining a central spare depot at your headquarters with 60% of spare inventory, while distributing 40% across regional hubs. This reduces total spare inventory while maintaining rapid access through expedited inter-hub transfers.
Comparative Analysis: Spare Management Strategies
| Strategy | Spare Ratio | Setup Cost | Annual Carrying Cost | Avg. Downtime Resolution | Best For |
|---|---|---|---|---|---|
| Minimal Reserves | 3-5% | Low | $2,000-5,000 | 3-5 days | Small, non-critical fleets |
| Standard Buffer | 10-15% | Medium | $8,000-15,000 | 1-2 days | Most enterprises |
| High Redundancy | 20-25% | High | $18,000-30,000 | 2-4 hours | Mission-critical operations |
| Just-in-Time (JIT) | 1-2% | Medium | $1,000-3,000 | 5-10 days | Stable, predictable fleets |
| Hybrid Model | 12-18% | High | $12,000-25,000 | 4-8 hours | Distributed enterprises |
What Metrics Should You Track to Measure Success?
Focus on four key metrics—spare utilization rate, mean time to replacement (MTTR), inventory turnover, and total cost of ownership (TCO)—to evaluate your spare device strategy’s effectiveness.
Spare Utilization Rate
Calculate: (Spare Devices Deployed Annually / Total Spare Devices × 365) × 100
A healthy rate is 60-80%. Below 60% suggests over-provisioning; above 80% indicates insufficient spares and potential downtime risk.
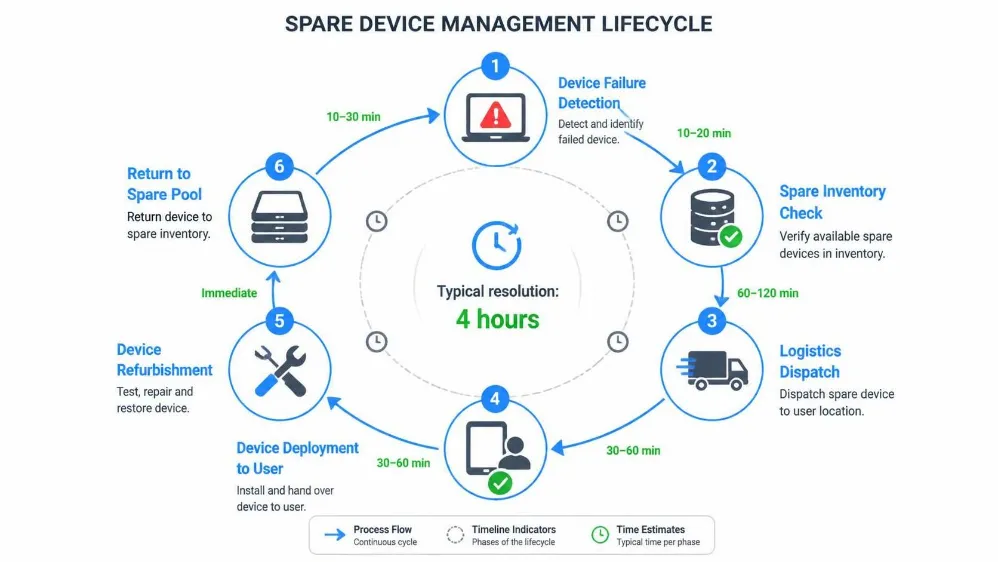
Mean Time to Replacement (MTTR)
Measure the average time from device failure to user receiving a replacement. Best-in-class organizations achieve MTTR under 4 hours; most enterprises operate at 8-24 hours. Tracking MTTR reveals bottlenecks in your redeployment process.
Inventory Turnover
Calculate: (Devices Deployed from Spares × 12) / Average Spare Inventory
Higher turnover (8-12x annually) indicates efficient inventory; lower turnover suggests excess capital tied up in spares.
Total Cost of Ownership (TCO)
TCO = (Spare Device Acquisition Cost + Annual Storage + Insurance + Handling + Obsolescence) / Devices Deployed
Understanding TCO per deployment helps justify your spare strategy to finance teams.
How Can You Reduce Spare Device Obsolescence?
Implement a lifecycle management strategy that cycles spares into active use before they become obsolete, paired with a graduated replacement schedule aligned to device end-of-life dates.
Spare devices sitting in storage for 2-3 years often become obsolete—software no longer supports them, batteries degrade, and they’re no longer compatible with current infrastructure. This wastes capital and creates e-waste.
Proactive Lifecycle Integration
Rather than keeping spares isolated, integrate them into your active fleet rotation. A device that’s been spare for 6 months should be deployed to a user nearing their device refresh cycle, allowing the newer device to enter the spare pool. This creates a continuous refresh cycle.
Graduated Replacement Schedule
Align spare inventory replacement with your device refresh cycle. If you replace 20% of your fleet annually, ensure 20% of your spare inventory is also replaced with current-generation devices. This prevents a situation where your spares are 2-3 generations behind your active fleet.
Refurbishment Programs
Partner with certified refurbishment vendors to restore end-of-life spares to like-new condition. This extends usable life by 1-2 years and reduces e-waste costs by 30-40%.
What Role Does Predictive Maintenance Play?
Predictive maintenance can reduce unplanned device failures by 35-45% and lower spare device requirements by 20-30%, making it a critical component of modern fleet management.
Traditional reactive maintenance waits for devices to fail. Predictive maintenance uses data analytics to anticipate failures before they occur.
Implementation Approach
Modern device management platforms collect telemetry data—battery health, storage capacity utilization, temperature patterns, crash logs, and performance metrics. Machine learning algorithms analyze this data to identify devices at risk of failure within 30-90 days.
Business Impact
When you identify a device likely to fail in 60 days, you can proactively replace it during a maintenance window rather than during critical business hours. This reduces emergency spare deployments by 35-45%, directly lowering your required spare inventory.
Cost-Benefit Analysis
Implementing predictive maintenance requires investment in analytics software (typically $2,000-10,000 annually for mid-sized enterprises) but generates ROI through reduced downtime, lower spare requirements, and extended device lifecycles.
How Should You Handle Cross-Location Spare Transfers?
Establish clear inter-location transfer protocols with pre-authorized logistics partnerships to enable rapid spare redistribution, reducing total spare inventory by 15-25% through geographic optimization.
In distributed enterprises, a spare device sitting unused in New York while an office in Chicago desperately needs one represents inefficiency and waste.
Transfer Protocol Framework
- Automated Triggering: When one location’s spare inventory drops below threshold and another location has excess, the system automatically generates a transfer request
- Logistics Partnerships: Negotiate standing agreements with courier services for next-day inter-office transfers at negotiated rates
- Accountability: Track which location “owns” each spare device and implement chargeback mechanisms to discourage hoarding
- Regional Consolidation: Establish regional spare hubs for rapid local distribution, reducing inter-hub transfers from 3-5 days to 24 hours
Cost Optimization
While transfer logistics cost $20-50 per device, this is typically cheaper than maintaining duplicate spares at every location. A company with 10 offices can reduce total spare inventory by 15-25% through optimized transfers.
Frequently Asked Questions
Q1: Should we maintain different spare ratios for different device types?
A: Yes, absolutely. Mission-critical devices (servers, network equipment) warrant 15-20% spare ratios, while non-critical devices (printers, peripherals) might only need 5-8%. Your spare strategy should reflect business impact, not treat all devices equally.
Q2: How often should we audit our spare device inventory?
A: Conduct physical audits quarterly and system audits monthly. Quarterly physical audits catch tracking errors and verify device condition; monthly system audits ensure your management platform accurately reflects reality.
Q3: What’s the best way to handle spare devices at end-of-life?
A: Establish a certified refurbishment and recycling program. Devices still under warranty should be refurbished and redeployed; older devices should be securely wiped and recycled through certified e-waste vendors to minimize environmental impact and recover material value.
Q4: Can we eliminate spares entirely through extended warranties or device-as-a-service models?
A: Partially. Device-as-a-service (DaaS) models shift spare management responsibility to vendors, but you’ll still need some local emergency inventory. Most enterprises find a hybrid approach—DaaS for non-critical devices, in-house spares for mission-critical equipment—most cost-effective.
Q5: How do we communicate spare device strategy to end-users?
A: Transparency builds trust. Share your MTTR targets, explain why spares exist, and educate users on how they can reduce device failures through proper care. When users understand the business logic, they’re more likely to report issues early and handle devices responsibly.
Q6: What’s the impact of remote work on spare device management?
A: Remote work significantly increases spare requirements because devices can’t be quickly swapped at an office. You need higher local inventory at distributed locations, faster shipping capabilities, and potentially home-delivery options for replacement devices.
Converting Insights into Action
For IT Operations Managers: Your competitive advantage lies in operational efficiency. Implementing the strategies outlined above can reduce your annual device-related downtime by 40-60% and cut replacement costs by 25-30%. Start with a comprehensive audit of your current spare inventory and failure patterns—the data will reveal immediate optimization opportunities.
For Finance Leaders: Spare device management directly impacts your capital expenditure and operational budgets. By optimizing your spare ratio and implementing predictive maintenance, you can reduce total device-related costs by 20-35% while actually improving service reliability. This is a rare opportunity to simultaneously reduce costs and improve service quality.
For Enterprise Procurement Teams: Your vendor relationships are critical to spare management success. Negotiate standing agreements for expedited replacements, establish preferred refurbishment partners, and implement automated reordering based on predictive analytics. These relationships transform spare management from reactive crisis response to proactive optimization.
Tags: device inventory optimization, downtime reduction, fleet deployments, fleet maintenance, IT asset management, managing spare devices, predictive maintenance, spare device management